Gold (GC/OG) Options Market Structure & 1-Day Technical Support Analysis
An evaluation of COMEX Gold (OG/GC) options positioning across multiple expirations reveals concentrated institutional defense zones below the current front-month December futures price. By synthesizing Open Interest alongside Delta, Gamma, Vega, and Theta metrics—combined with macro 1-Day timeframe technical chart analysis—traders can identify high-probability institutional reaction zones.
1. 1-Day Timeframe Chart Analysis: The Three Key Support Tiers
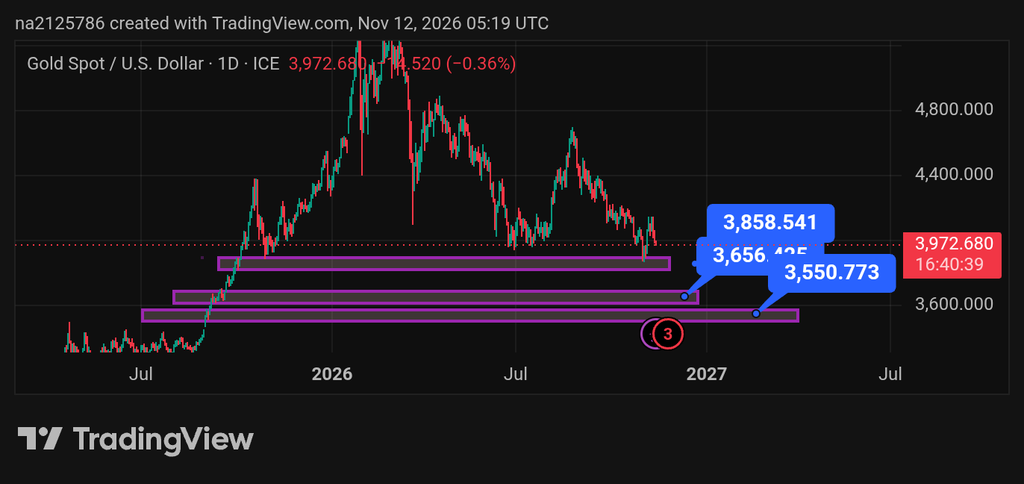
Based on the Spot Gold 1-Day timeframe chart structure (TradingView), price action highlights three major structural support levels where significant institutional demand and liquidity pools reside:
- First Support Level (~3,858.54): The initial higher timeframe demand zone. Market may react and bounce upward directly upon touching this first level.
- Second Support Level (~3,656.40): If the first support level fails to respect the price and is breached, the market is likely to descend toward the second major support zone to find buyers and reverse upward.
- Third Support Level (~3,550.77): The deep structural floor. If the prior levels are bypassed, the market will almost certainly test and respect this final tier before initiating a strong bullish continuation.
2. Smart Money Concepts (SMC) Entry Execution Plan at Support
Taking blind or instant limit orders directly upon a touch of these major support levels carries a high probability of drawdown and increased risk of loss. To filter false breakouts and secure high-probability Buy entries, traders must follow a strict multi-timeframe execution workflow:
- Step 1: Shift to Lower Timeframes (4-Hour or 1-Hour): When price approaches one of the three designated daily support zones, drop down to the 4-hour (4H) or 1-hour (1H) timeframe to monitor price action behavior.
- Step 2: Identify Inducement (IDM) and Change of Character (CHOCH): Wait for the lower timeframe to form an Inducement (IDM) followed by a clear Change of Character (CHOCH), signaling an institutional shift in market structure from bearish to bullish.
- Step 3: Refine Entry on the 15-Minute Timeframe: Once the CHOCH is confirmed on the 1H/4H chart, drop down to the 15-minute (15M) timeframe to pinpoint a refined entry point (such as an Order Block or breaker block).
- Execution: Execute your long (Buy) position from this refined 15M setup rather than taking blind market orders at the raw support line, thereby minimizing risk and optimizing the risk-to-reward ratio.
3. Options Open Interest (OI) Analysis: Mapping the Put Walls
Open Interest distribution highlights the primary strike levels where institutional traders hold active contracts, acting as structural floors when price approaches from above. Across near-term and medium-term contracts, downside liquidity is heavily stacked:
- 3950 Strike (Immediate Support): Holds substantial Puts across near-term and medium-term expirations.
- 3900 Strike (Primary Institutional Put Wall): Features a massive concentration of active Put contracts, serving as a primary downside barrier.
- 3850 Strike (Deep Structural Support): Contains heavy institutional Put clustering acting as a secondary floor.
- 4000 Strike (Key Pivot & Magnet): Carries the largest concentration of options volume, turning into primary support once reclaimed.
4. Option Delta Matrix: Dealer Hedging & Directional Exposure
The Open Interest X Delta Matrix measures net directional exposure, showing where market makers must adjust underlying futures hedges as price fluctuates. Heavy Put Delta below spot creates natural support as dealers unwind short hedges:
- 3950–3955 Zone (Near-Term Delta Cushion): Displays heavy negative Put Delta alongside call clustering.
- 3900 Strike (Multi-Expiry Delta Floor): Registers heavy multi-month Put Delta positioning, acting as a strong structural floor.
- 3850 Strike (Secondary Delta Defense): Shows balanced multi-month Put Delta options positioning.
- 4000 Strike (In-The-Money Pivot): Acts as an overhead pivot until price closes back above 4000.
5. Option Gamma Profile (1 Pt & 1 Pct): Volatility Buffers & Pinning Zones
Gamma measures the rate of change in Delta for every 1-point or 1-percent move in underlying gold futures, pinpointing where dealer hedging flows suppress realized volatility:
- 3950–3955 Zone (Immediate Gamma Buffer): Provides robust intraday and swing demand buffering.
- 3900 Strike (Major Downside Gamma Wall): Features heavy multi-expiry Put Gamma concentration.
- 3850 Strike (Lower Volatility Floor): Acts as an extended cushion against sharp corrective slides.
- 4000 Strike (Primary Gamma Magnet): Peaks in total exposure, creating a strong pinning effect.
6. Option Vega Matrix: Implied Volatility Sensitivity
Vega quantifies how much option portfolio values change per 1% shift in Implied Volatility (IV), revealing where long-dated institutional hedging is concentrated:
- 3950 Strike (Short-to-Medium Term Vega Support): Carries extensive multi-expiry Put Vega.
- 3900 Strike (Core Institutional Volatility Floor): Features massive institutional Put Vega concentration across long-dated contracts.
- 3850 Strike (Tail-Risk Vega Hedge): Designed to absorb high-volatility liquidations.
- 4000 Strike (Peak Volatility Node): Represents the core volatility node on the surface.
7. Option Theta Matrix: Time-Decay & Seller Defense Zones
Theta measures daily time-value decay across active option strikes, highlighting where option writers have financial incentives to defend price levels:
- 3950 Strike (Near-Term Decay Support): Displays heavy negative Put Theta.
- 3900 Strike (Primary Put Seller Floor): Records massive time-decay support from option sellers.
- 3850 Strike (Outer Decay Boundary): Serves as an outer perimeter for premium collection.
- 4000 Strike (Maximum Time-Decay Magnet): Incentivizes price pinning near the psychological threshold.
Data Attribution & Financial Disclaimer Market data, chart structures, and options metrics referenced in this analysis are derived from publicly observable COMEX Gold (OG/GC) futures statistics, TradingView technical charts, and CME Group (QuikStrike) analytical tools. CME Group, COMEX, and QuikStrike are trademarks of their respective owners; this website is an independent publisher and is not affiliated with, endorsed by, or sponsored by CME Group. All content, technical levels, and SMC trading strategies provided in this article are for informational and educational purposes only and do not constitute formal financial or investment advice. Trading derivatives and leveraged financial instruments carries a substantial risk of loss, and market participants are solely responsible for managing their own risk and execution decisions.